Started using this great app and found this screen:

:(
So I thought yeah... few minutes with MobileSubstrate and this message is gone, and its true the message was gone but it doesn't help me. The app is ONLY UI to some other process called MyWiCore which contains all the logic.
This process is mainly wrote in plain C so MobileSubstrate wont help me on this. Going to GDB and IDA then.
Attaching gdb to MyWiCore:

what????? Segmentation fault, gdb crashes !!
maybe running it from the beginning:

exit code 55.. hmm..
back to the gdb crash, I need to find out why is gdb crashing, so its time for gdb-ception:
running gdb inside gdb for debugging gdb.

/usr/libexec/gdb/gdb-arm-apple-darwin /usr/libexec/gdb/gdb-arm-apple-darwin
gdb crash on ptrace. $r0 (argument to ptrace) is 14. accroding to Apple
http://www.opensource.apple.com/source/xnu/xnu-792.13.8/bsd/sys/ptrace.h
#define PT_ATTACHEXC 14 /* attach to running process with signal exception */
so why gdb crashes?
looking more in Apple sources, specific in ptrace source:
http://www.opensource.apple.com/source/xnu/xnu-792.13.8/bsd/kern/mach_process.c
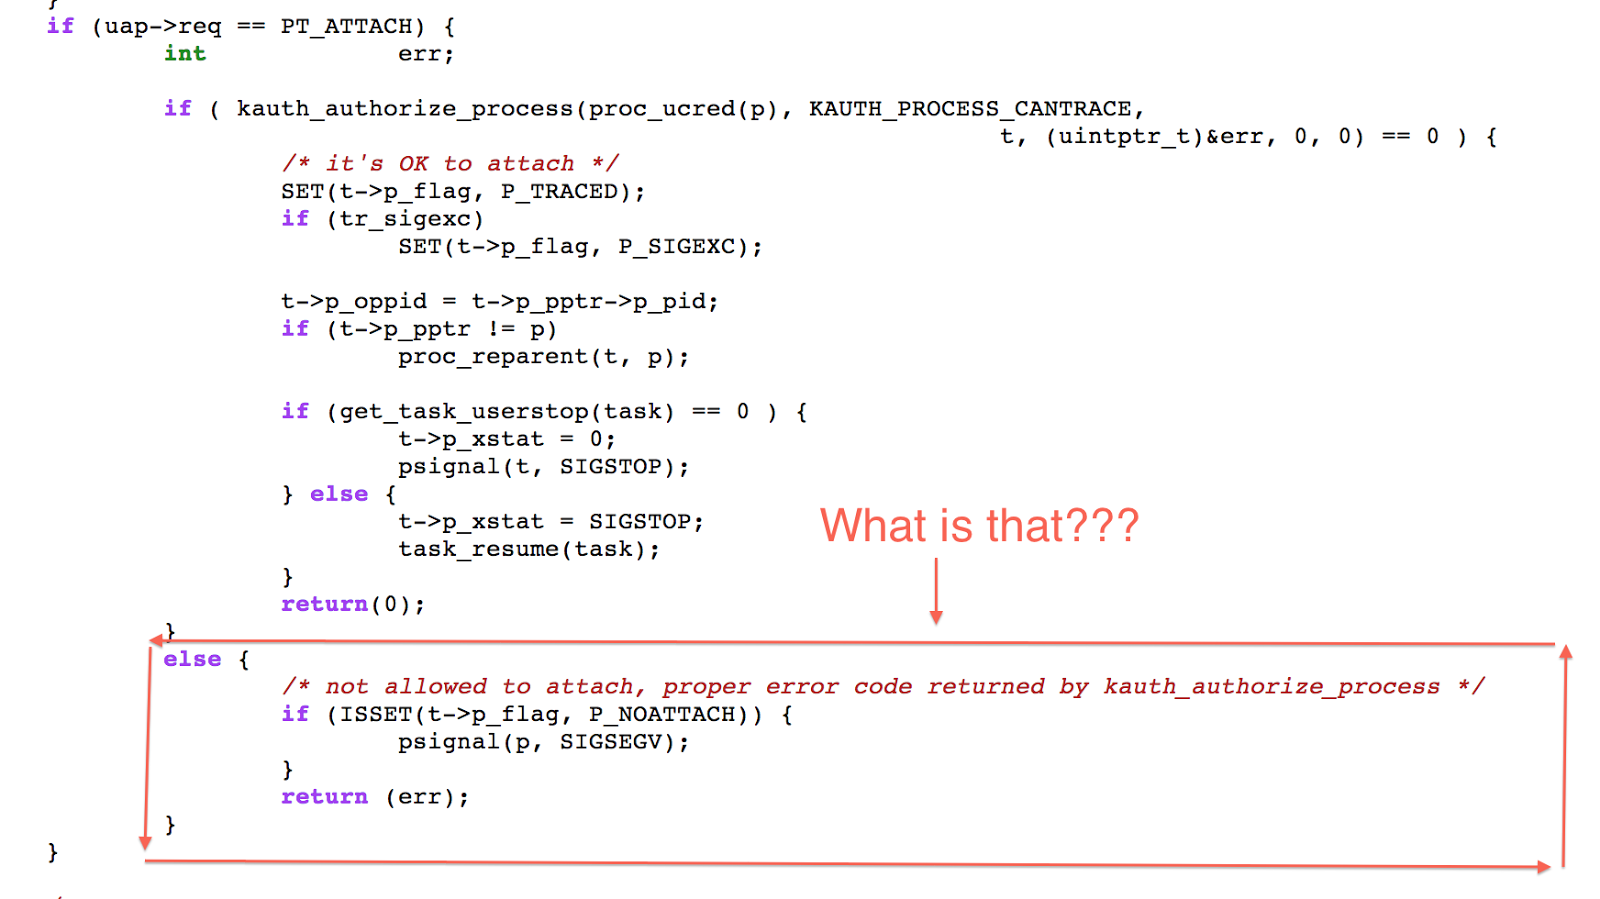
what is that??
P_NOATTCH flag?
this code inside ptrace control the flag:

so calling ptrace with the flag PT_DENY_ATTACH will cause my gdb to crash.
Attaching to process when it already run is not possible.
OK then, lets remove the call for PT_DENY_ATTACH and run the process from the beginning. Hooking each call to ptrace from the beginning of running should block this anti-debugging.
Turn out that not really:

ah..... :\
Looking at the code in IDA, in the first lines I see this:

SVC 0x80 is interrupt, this is how the syscall user-mode wrapper looks inside the libc.
The process move to register 12 the syscall number (e.g 26/1a for ptrace in this table), move arguments to r0, r1, ... and then raise interrupt (0x80). The kernel catches this interrupt, then realising its 0x80 meaning calling to sycall, understanding which syscall by r12, calling the syscall and returning the value and the runtime back to the process.
This mean I cant put breakpoint in gdb on ptrace, because the ptrace in the user-mode has no meaning. I can remove all the SVC 0x80 from the binary, but further looking show that they use the SVC 0x80 to call every syscall in their code, so basically they make the libc code that create user-mode syscalls inline. Next step is to make idapython code that statically understand what goes into r12, and if its ptrace remove the SVC 0x80.
import idc, idautils

addrs = []


ea = 0x2050
addrs = []
while(idc.FindBinary(ea,SEARCH_DOWN, "80 df") != idaapi.BADADDR):
 ea = idc.FindBinary(ea,1, "80 df")
 addrs.append(ea)
 ea = ea + 1
 print ea

def get_addrs():
 print len(addrs)
 out_addrs = []
 for addr in addrs:
  addr = addr
  orig_addr = addr
  i = 0
  op_c = 'start...'
  while((op_c.find('MOV             R12,') == -1) and (op_c.find('MOV.W           R12, #') == -1 )):
   addr = idc.PrevHead(addr,0x0)
   op_c = idc.GetDisasm(addr)
   i = i + 1
   if (i > 1000):
    break


  if (op_c.find('MOV             R12, #0x1A') != -1 or op_c.find('MOV.W           R12, #0x1A') != -1 ):
   if("SVC" in idc.GetDisasm(orig_addr)):
    out_addrs.append(hex(orig_addr))

 print len(out_addrs)
 return  out_addrs
This code search for all the SVC that are calling ptrace and print them.
Putting all the problematic SVCs in svc_location and with gdb scripting removing them:
breakpoint _start
breakpoint command add -s p 1

import svc_locations

print 'Main!!'
print 'Removing ptraces'

for i in range(len(svc_locations.ptraces)):
        lldb.debugger.HandleCommand("memory write -s 2 " +  svc_locations.ptraces[i] + " 0x46c0 ")
lldb.process.Continue()
Next I started running the app and soon the app crashes. Back trace the crash with gdb leading me to this piece of code. This is checksum on the code segment (those guys are really fighting), they use crc32 on the code segment:

and patch with gdb.. something like that:
b *(ADRESS OF CMP R0,R2)
commands
set $r0=$r2
c
end
after all of this you should be able to debug it without any anti-debug crashing issues.
The last issue that I see is the functions dispatchers. Each call address is calculated, making the static reversing near to impossible. Nothing GDB and idapython cant fix. First, with idapython I search for all of the addresses that using the dispatcher. Then I manually call the dispatcher in a loop with gdb and print the address, then I edited IDA address with idapython to the address that gdb printed.
Calling the dispatcher function using gdb with all the addresses:
dispatch_locations = '''DIAPTCHER_LOCATION_1
DIAPTCHER_LOCATION_2
...
...'''

op_str = '''
b *0xDISPATCHER_ADDR
commands
    set $lr = PYTHON_WILL_REPLACE_THIS_ADDR
    c
end
b *0xDISPATCHER_ADDR
commands
    p/x $r0
    delete
end
jump *0xDISPATCHER_ADDR
'''


for addr in dispatch_locations.split("\n"):
    print op_str.replace('PYTHON_WILL_REPLACE_THIS_ADDR', str(hex(int(addr,16)+3)))
getting the gdb output into IDA with idapyhon:
functions_list = '''0x2fed2000  __dyld_stub_binding_helper
0x2fed2008  __dyld_dyld_func_lookup
0x2fed2010  __dyld_offset_to_dyld_all_image_infos
0x2fed2028  __dyld__dyld_start
0x2fed20b4  __dyld_branch_to_lookupDyldFunction
0x2fed20c0  __dyld_yld_stub_binding_helper
0x2fed20c4  __dyld_dyld_fatal_error
0x2fed20cc  __dyld_gdb_image_notifier
0x2fed20d0  __dyld__ZN13dyldbootstrap5startEPK12macho_headeriPPKclS2_Pm
0x2fed2338  __dyld__Z30coresymbolication_unload_imageP25CSCppDyldSharedMemoryPagePK11ImageLoader
0x2fed246c  __dyld__Z28coresymbolication_load_imageP25CSCppDyldSharedMemoryPagePK11ImageLoadery
0x2fed2598  __dyld__ZN4dyld14addMappedRangeEP11ImageLoadermm
0x2fed2624  __dyld__ZN4dyld19removedMappedRangesEP11ImageLoader
...'''

callers = ['DIAPTCHER_LOCATION_1', 'DIAPTCHER_LOCATION_2', ...]

gdb_dispatch = open('disptacher_static_log.txt', 'rb').read()
gdb_dispatch_l = gdb_dispatch.split("\n")
gdb_l = []
i=0


def get_function(addr):
    for line in functions_list.split('\n'):
        if line.find(addr) == 0:
            return line[line.find(' ')+2:]
    return addr

for line in gdb_dispatch_l:
    if (line.find('$') == 0):
        gdb_l.append(line.split(' = ')[1])

for line in gdb_l:
    idc.MakeComm(int(callers.split('\n')[i],16),get_function(str(hex(int(line,16)-1))))
    #if(str(hex(int(line,16)-1)) in functions_list):
    print callers.split('\n')[i] + '  -> ' +  get_function(str(hex(int(line,16)-1)))
    #else:
    #    print callers.split('\n')[i] + '  -> ' + line
    i=i+1
From here on is suppose to be smooth sailing but the license mechanism is complicated and all the anti-debugging was taking too much time for me to continue working on it. The amount of time that I worked on this project (on my free time) was too much. The developers of this app are good and did a great job, its very difficult to reverse engineer this app, even without the anti-debugging its complicated because everything is in unix messages and message handlers, and there is a lot of code. Despite the fact that I didnt success I am still very pleased with the progress and learn a lot from doing it. Hope you enjoyed reading.
No comments:
Post a Comment